
Here is what the International Energy Authority said happened to carbon emissions last year across the globe.
Carbon emissions rose by 1.7 per cent in 2018 to a record 33.1 billion tonnes, with coal making up a third of the total increase
That is 560 million tCO2 more carbon emitted than the previous year.
That increase is equivalent to the total emissions of the international aviation industry or if you prefer, the annual emissions for Australia.
Recall that 1990 was a pivotal year for climate change issues. It was chosen, arbitrarily for those not in the know and all those with an ounce of common sense, as the benchmark year to compare targets for emission reduction.
In 1990 global greenhouse gas emissions were roughly 22.4 billion tCO2.
Rather than concern ourselves with the increase since then, yep it is half as much again, let’s focus on what a 1.7 per cent increase on 22.4 billion looks like.
It’s 381 million tCO2e
Buckets of water example
Now, let’s suppose that I have two buckets the size of laundry baskets. Each bucket is big enough to hold 50 litres of water.
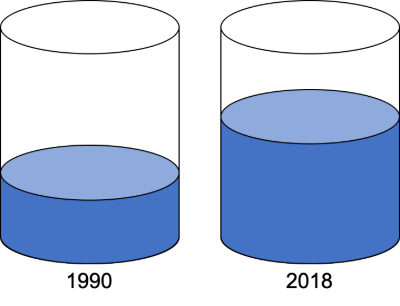
The first bucket is the 1990 bucket. It contains 22.4 litres of water.
The second is the 2018 bucket and it contains 33.1 litres of water.
If each day I added 1.7% of the starting volume to each bucket (381 ml and 560 ml) in 72 days the 1990 bucket would be full.
The 2018 bucket is spilling water on the floor in 30 days.
Less than half the time!
Same percentage. Very different result.
The analogy is not quite reliable for the greenhouse gas issue. The atmosphere may be like a bucket in that it has a finite volume but it is a huge bucket unlikely to overflow with gas.
The issue for greenhouse gases is, of course, the way they alter the atmospheric composition and change the warming potential, retaining more of the sun’s energy as the proportion of greenhouse gases rises.
The per cent change result still holds. 1.7 per cent of the 2018 amount has a much bigger effect than 1.7 per cent of the 1990 amount.
Global population example
The global population growth rate in 2018 is around 1.1% or roughly 83 million people added to the mix each year.
This percentage gain is less than the 1.6% gain in 1990 that delivered roughly the same number of new people.
So again let’s do the bucket test. This time we’ll go with the 1.1 per cent gain and use slightly smaller, 10-litre buckets.
The 1990 bucket starts with 5.3 litres of water and the 2018 bucket has 7.2 litres.
If each day I added 1.1% of the starting volume to each bucket (58 ml and 79 ml) in 81 days the 1990 bucket would be full.
The 2018 bucket is spilling water on the floor in 35 days.
Lower percentage but a faster fill. Ouch.
Pay rise example
Is it fair to give a 1% pay rise to all employees in the company? Sounds fair.
Everyone gets the same proportional raise, all the boats get to float. Except that the CEOs 1% gets him a new fridge out of the first paycheck and the tea lady gets a coffee at Starbucks.
Be aware of percentages when the media spout them.
They are only useful if you know the amount the percentage refers to.

Pingback: Take care with percentages – sustainably FED